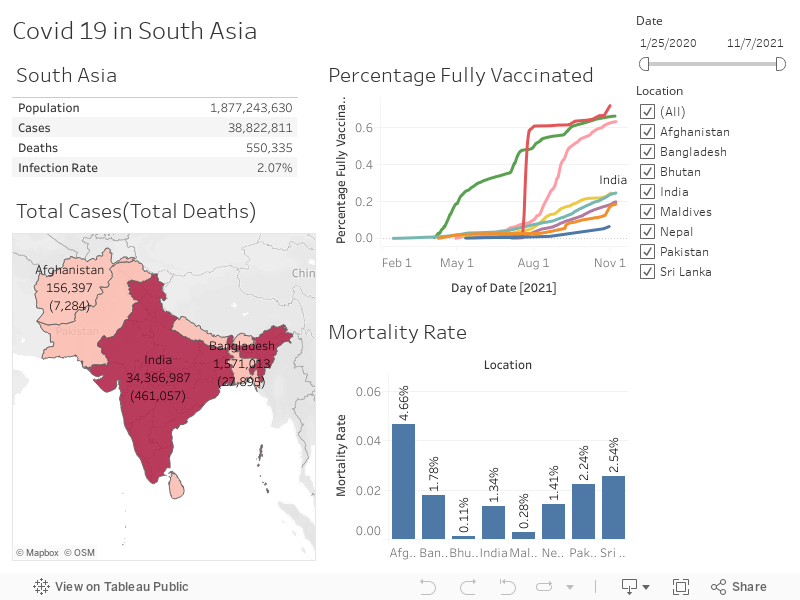
Hi! Below you will find an interactive dashboard on Covid 19 in South Asia.
Please feel free to use the filters and explore the visualization as you like.
*View in full-screen mode for a better experience*
Programs used: Tableau Public
Visit our Tableau Public account here
Videos
Codes
Access SQL codes on GitHube here.