Formula 1 racing has been thrilling fans since 1950, but wouldn't it be awesome to dig deeper into the data behind your favorite drivers who make this sport so interesting?
In this article, I'll show you an interactive dashboard that does just that. By scraping the official Formula 1 website, I put together an interactive tool that brings all this amazing data to life.
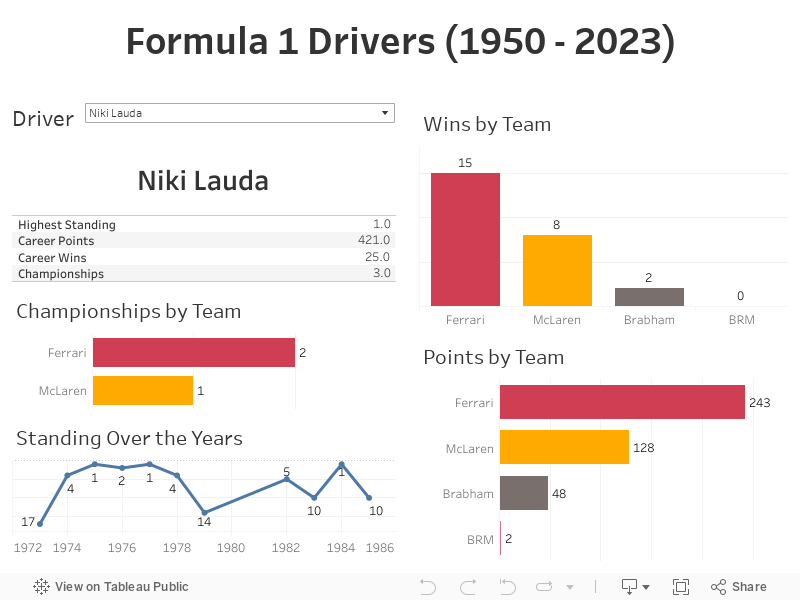
This dashboard is packed with insights. You can check out general stats like wins, points, and highest standings for drivers, see how their standings have changed over the years, and even explore team achievements with visuals on championships, wins, and points by team.
Whether you're a die-hard F1 fan, a data enthusiast, or just curious, this dashboard offers a fun and engaging look at the drivers who’ve shaped the sport. Follow along as I walk you through how I built it, making complex data simple and exciting!
Please use full screen when interacting with the dashboard for the best experience.
Access the code here: https://github.com/snadikari/formula1_drivers_1950_2023/tree/main
Access the full dashboard here: https://public.tableau.com/app/profile/sachintha.adikari/viz/Formula1Drivers1950-2023/Dashboard1
The Dashboard
What are we doing here?
Today we are going to scrape the Formula 1 website and create an interactive dashboard to view some fun stats about a favorite or least-favorite Formula 1 driver from all the way back from 1950 to the latest season in 2023. We will dig up things such as:
- General stats (wins, points, highest standing)
- Standing over the years
- Championships by team
- Wins by team
- Points by team
This will involve
- Scraping Formula 1 website using python packages such as Beautiful Soup
- Cleaning, analyzing and aggregating data using SQL
- Creating an interactive dashboard using Tableau Public
Scraping the Formula 1 website
Code available at: https://github.com/snadikari/formula1_drivers_1950_2023/blob/main/formula1_champions.ipynb
First of all, we need to identify what kind of information we need. For our goal, we will need a source where we have years, driver names, team names, points, wins and number of championships.
After exploring the Formula 1 website, you might notice that even though some of these data points are not specifically available, there is enough useful data available that we can manipulate to get the data points we need.
We will look at 2 web pages.
- Driver standing for a chosen year
(https://www.formula1.com/en/results.html/1950/drivers.html)
Contains- Driver standing
- Driver name
- Nationality
- Car
- Points
- Race results for a chosen year
(https://www.formula1.com/en/results.html/1950/races.html)
Contains- Grand Prix name
- Date of the race
- Winner’s name
- Winner’s car
- Laps
- Total race time
We can combine the data points of these pages to get what we need.
Things to consider:
- Make sure the table format is consistent through the years
- Since one page only shows data for one year at a time, we will have to loop through the links to collect all the data from 1950 to 2023.
- Add the year for each row since it is not available in the original table.
We will loop through each page and export the data into 2 separate CSVs, one for the driver standing and the other for race results.
Code available at: https://github.com/snadikari/formula1_drivers_1950_2023/blob/main/formula1_champions.ipynb
Cleaning driver data using SQL
Code available at: https://github.com/snadikari/formula1_drivers_1950_2023/blob/main/formula_1.sql
Now that we have the driver standings and race results, we will import them to MySQL and check whether everything is in order for the visualization.
Data Consistency
Here are some inconsistencies we encounter:
- Driver symbols
Sometimes Formula 1 changes the driver symbol they use for the driver. For example, Max Verstappen is given the symbol VES in 2015 but from 2016 onwards it changes to VER. Because the driver standings table shows the driver name along with the symbol (Max Verstappen VER, Lewis Hamilton HAM, Fernando Alonso ALO), this inconsistency will create an unnecessary split for cases like Max’s.
We have 2 options
- Get rid of the symbol
- Normalize the symbol
Since we have no use for the symbol in our project and also because the driver name is consistent in this particular dataset, we will opt to remove the symbol and solely focus on the driver name.
- Team names
In Formula 1, it is mandatory to mention the team’s engine supplier at the end of the team name such as Red Bull Racing Honda where Honda is the engine supplier, unless a team makes its own engines such as Ferrari and Mercedes in which case the team name is enough.
However, because engine suppliers can change from season to season, team names can also change along with it. For example, Mclaren Mercedes, Mclaren TAG, Mclaren Renault and Mclaren Honda are all the same team with different engine suppliers.
If we are going to keep track of the core team of each driver, we need to ignore the engine supplier and focus on the team name.
First step we can take is removing the last word in each team name where the team name is longer than 1 word. Chances are the last word is the engine supplier’s name.
But wait, what about the teams making their own engines? If we remove a word, we will be removing a part of the core team’s name!
The only way to move past this problem is to either have access to a comprehensive database of Formula 1 core team names, or know it from being familiar.
Unfortunately for this case, we will be relying on familiarity. If you are not a Formula 1 fan, this step might be uncomfortable for you. If you come across a database, please go for it.
In our dataset, the only team with more than 1 word that falls into this category is Alfa Romeo in 1950. Therefore, we will exclude Alfa Romeo from this broad step.
After the initial run, you will notice there are still some duplicates remaining. These are from teams where the engine suppliers have more than 1 word to their name and therefore a part of their name is still remaining. We will take a more manual approach to inspect and clean these.
Code available at: https://github.com/snadikari/formula1_drivers_1950_2023/blob/main/formula_1.sql
Manipulating the data
Remember that we didn’t have the race wins for each driver on the Formula 1 website? Well guess what? We can aggregate that data from the race results table by counting the number of times the driver’s name appears on the winner’s column! Additionally, we can combine this data to know the number of race wins by each driver for different teams because the winning car is also available there.
Code available at: https://github.com/snadikari/formula1_drivers_1950_2023/blob/main/formula_1.sql
Final Export
In the final export, we will combine the necessary columns from the driver standings table and the race results table to get an aggregate dataset for the visualization, containing:
- Year
- Position
- Driver
- Car
- Points
- Wins
We get this by using an INNER JOIN to combine the two tables by the year and driver name columns. This ensures that we get the number of wins and points for each driver in the respective year.
The rows are especially grouped by year, driver name and car so that we can separate the wins and points by team in the rare chance that a driver has won races or scored points with different teams in the same year.
Code available at: https://github.com/snadikari/formula1_drivers_1950_2023/blob/main/formula_1.sql
Creating a dashboard using Tableau
Dashboard available at: https://public.tableau.com/app/profile/sachintha.adikari/viz/Formula1Drivers1950-2023/Dashboard1
For this visualization, we will use Tableau Public. You can create an account at https://public.tableau.com/.
Since we created a final export using SQL, there is no need for complicated dataset combinations.
We will create 5 worksheets and simply drag and drop the necessary fields to create:
- Standing over the years
- Fields: SUM(Standing), Year
- Type: Line graph
- Points by Team
- Fields: SUM(Points), Team
- Type: Bar chart
- Wins by Team
- Fields: SUM(Wins), Team
- Type: Column chart
- Championship by Team
- Fields:SUM(Standing), Team
- Type: Column chart
- Driver name
- Fields: Driver
- Type: Text
- Stats
- Fields: MIN(Standing), SUM(Points), SUM(Wins)
- Type: Text
The only extra step in all of these is when visualizing Championships by Team. Since we don’t have a direct column for this, we will have to manipulate for this output. For this we will create a filter using the Standing field and filter it to ‘1’, which means it will only show the count for Position 1 in driver standings which is the position of the champion.
Apart from that, we will use a filter across all of the worksheets to narrow the dashboard to 1 driver. For this we will use the Driver field and apply it to all the worksheets.
Afterwards, we can create a dashboard and drag and drop the worksheets in a desired arrangement for the final product.
And that's it! Now you have a dashboard you can visit to anytime you want to know more racing details about your favorite driver.
Dashboard available at: https://public.tableau.com/app/profile/sachintha.adikari/viz/Formula1Drivers1950-2023/Dashboard1